Rendering the 1st Image

PPM Image Format
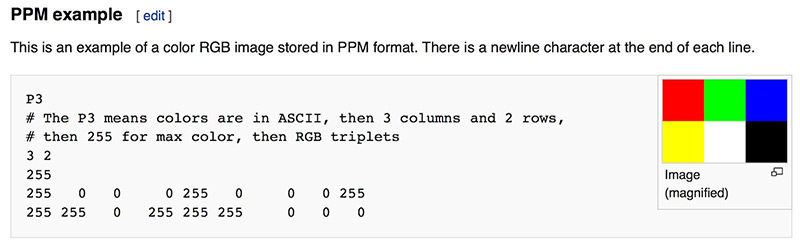
The PPM (or Portable Pix Map) image format is encoded in human-readable text. Below is a brief synopsis of the format which will aid you in being able to load a PPM image. If you are interested in more information, the formal image specification can be found here.
Sample ppm file:
    P3
    4 4
    255
    0  0  0   100 0  0       0  0  0    255   0 255
    0  0  0    0 255 175     0  0  0     0    0  0
    0  0  0    0  0  0       0 15 175    0    0  0
    255 0 255  0  0  0       0  0  0    255  255 255
Image Header
The first few lines are defined as the imageheader. They provide an overview of the contents of the image. PPM headers consist of four enteries, which will be defined using the example:
    P3
    4 4
    255
P3 defines the image format; that is, what type of PPM (full color, ASCII encoding) image this is. For this assignment it will always be P3.
Next comes the number of columns and the number of rows in the image. The example is a 4 pixel by 4 pixel image
Finally, we have the maximum color value. This defines the scale of values possible for the color intensities. This can be any value, but a common value is 255, meaning the red, green, and blue values for a pixel can range from a value of 0 upto 255.
The way you see the header presented is how it should be spaced out.
Image Body
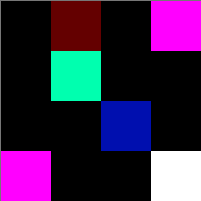
The image body contains the actual picture information as a series of RGB values. Each pixel of the image is a tiny, colored square. In the PPM file, each pixel is defined by a triplet of values representing how much red, green, and blue (RGB) are present. So, the first pixel, which has a value of 0 0 0, is black, and the last pixel, 255 255 255, is white. r By varying the levels of the RGB values you can come up with any color in between.
Note that color values must be separated by a space, but after that any additional whitespace is ignored by the image viewer. In the sample ppm above we used additional whitespace to format the pixel values so that it is easy for a human to understand, but the computer doesn't care if everything is on one line, if there is one line of RGB values per line of the image, or some mix. You should not assume one line in the file corresponds to one line in the image.
The example image above would look something like this:
A more simple example is given below:
C++ code to create the image
#include <iostream>

int main() {

    // Image

    const int image_width = 256;
    const int image_height = 256;

    // Render

    std::cout << "P3\n" << image_width << ' ' << image_height << "\n255\n";

    for (int j = image_height-1; j >= 0; --j) {
        for (int i = 0; i < image_width; ++i) {
            auto r = double(i) / (image_width-1);
            auto g = double(j) / (image_height-1);
            auto b = 0.25;

            int ir = static_cast<int>(255.999 * r);
            int ig = static_cast<int>(255.999 * g);
            int ib = static_cast<int>(255.999 * b);

            std::cout << ir << ' ' << ig << ' ' << ib << '\n';
        }
    }
}
This code is an implementation of a very simple ray tracer that generates a 256x256 image with a gradient from blue to green.
The main function initializes the image dimensions and prints out the header information for a PPM (Portable Pixmap) image file format. This includes the format type ("P3"), the image width and height, and the maximum color value (255, which represents full color intensity).
The following nested for-loops then iterate over each pixel in the image, starting from the top-left corner and moving from left to right, then top to bottom. For each pixel, the code calculates the values for red (r), green (g), and blue (b) colors based on the pixel's x and y coordinates in the image.
The color values are then converted to integers and printed out to the console in the format "red green blue". The color information for all the pixels in the image is printed out in this way, resulting in a text file representation of the image.
Finally, when this code is executed, the output can be redirected to a file and saved as a PPM image file. When opened with an appropriate image viewer, the output image will show a gradient from blue to green, with the intensity of the colors increasing from left to right and top to bottom.
Creating the image file
Since we use the standard output, we only get numbers in the output. The below code snippet shows the output:
P3
256 256
255
0 255 63
1 255 63
2 255 63
3 255 63
4 255 63
5 255 63
6 255 63
7 255 63
8 255 63
9 255 63
...
Hence we have to redirect the output to an image file. To do this we direct it to a ppm file which is a simple image format.
program.exe > image.ppm
Now in the program directory, we get an image.ppm file. This file can be viewed online or in the client itself if it supports it.
The final image is:
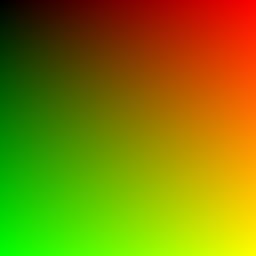
Red goes from fully off (black) to fully on (bright red) from left to right, and green goes from black at the bottom to fully on at the top. Red and green together make yellow so we should expect the upper right corner to be yellow.
Blue is constant as it is shown in the above code..
Finally, as a quality improvement, we add a progress indicator in the above C++ code to display the no of scan lines that are remaining.
std::cerr << "\rScanlines remaining: " << j << ' ' << std::flush;
This has 2 main advantages. One it can be used to detect if the program stopped running and second it can be used to track how much the program has completed.


